
The following article was a guest contribution by Steven Liu.
Partially inspired by Arjun’s ultimately fruitless analysis of ACF Fall, I decided to take a closer look at the Groger Scores to see how well they actually summarize which teams win and lose on the buzzer. I should say up front, of course, that I am not a statistician, and there may be some details that I should account for but haven’t out of ignorance. So, caveat emptor, I suppose.
In over 1800 games of quizbowl across 16 tournaments using sets at regular difficulty or above (that I could easily find on the database; there are definitely more out there), 391 were played between two teams who received a Groger Score in the October 29th rankings. For each of those games, two data points were recorded, one for the winning team and one for the losing team, both with the difference in Groger Score to the other team and whether or not they won (a 1 for win or a 0 for a loss). From there, I did a logistic regression to get an estimate for how likely one team is to win or lose against another based on the difference in their Groger Scores.
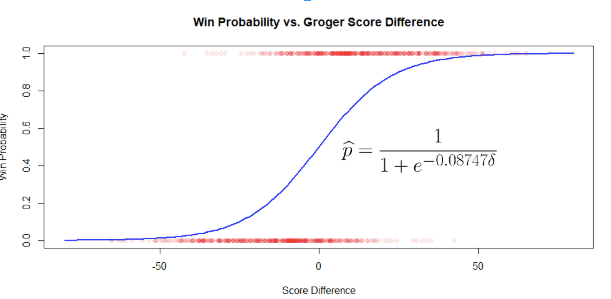
First thing’s first, the p-value for this regression is small enough that R refuses to tell me the exact value, and only says that it’s less than 2e-16. More interestingly, fairly small differences in Groger Score make one side or the other a fairly healthy favorite: according to the model, an 8-point lead gives a 2 in 3 chance of winning, while a 25-point lead gives a solid 9 in 10 chance of victory.
Before I move on to the model for estimating the margin of victory, I would like to note that I didn’t check the rosters of each team for depleted or unusual lineups, which may be worth keeping in mind. I also did my best to check for teams whose names were recorded differently than in Groger Ranks, either as pseudonyms or different forms of the name, such as Taylor for James E. Taylor. With that out of the way, here’s the model for margin of victory.
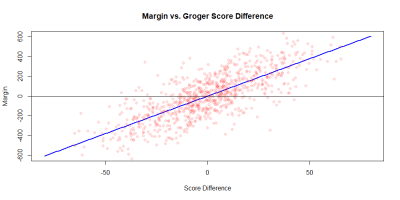
The correlation here is moderately strong, with a correlation coefficient of 0.7631. It also more or less agrees with the first model (which makes sense; they are based on the same data after all). The standard error of residuals in the linear model is 152.7 points which, roughly speaking, means a tie game is about one standard deviation away from the prediction for every 20 points of score difference.
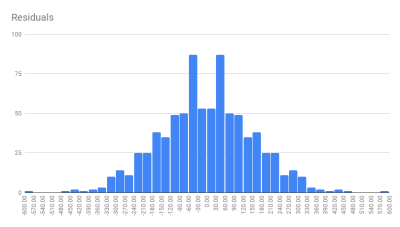
There does also seem to be an interesting phenomenon where games within about 30 points of the prediction occur somewhat more rarely than games slightly farther out. I suspect this is just a fluke of the data, but if anyone has a plausible explanation (or a way to tell whether it’s significant) I’d love to hear it.
Of course, as we all know, the nats grind never stops. To close this article, I seeded the top 24 teams in Tier I (and the 25th-28th teams to fill in the superplayoffs) of a simplified mock NSC to make a very, very tenuous forecast for how nationals would shake out if they were played today.
| Team | Avg | Top 16 | Top 8 | Champ |
| TJ A | 3.55 | 98.0% | 86.5% | 33.4% |
| Hunter A | 4.40 | 96.7% | 81.9% | 22.5% |
| DCC A | 4.93 | 95.8% | 78.6% | 18.0% |
| Taylor A | 5.98 | 93.6% | 71.7% | 11.8% |
| Canyon Crest “B” | 8.72 | 86.1% | 53.6% | 4.1% |
| Uni Lab A | 10.19 | 81.2% | 44.6% | 2.3% |
| Wayzata A | 10.40 | 80.6% | 43.1% | 2.1% |
| Miami Valley A | 11.10 | 77.9% | 38.1% | 1.6% |
| Ladue A | 13.19 | 68.8% | 27.3% | 0.7% |
| High Tech A | 13.98 | 64.9% | 24.7% | 0.5% |
| Beavercreek A | 14.03 | 64.3% | 24.7% | 0.4% |
| Carnegie A | 14.16 | 63.6% | 24.1% | 0.4% |
| Lexington A | 14.63 | 61.2% | 22.3% | 0.3% |
| Chattahoochee A | 14.63 | 61.3% | 22.4% | 0.3% |
| Blair A | 14.77 | 60.9% | 21.6% | 0.3% |
| LASA A | 15.06 | 59.3% | 19.8% | 0.3% |
| Stevenson A | 15.25 | 58.3% | 19.2% | 0.3% |
| Ithaca A | 15.83 | 55.3% | 17.9% | 0.2% |
| Stanford OHS A | 15.87 | 54.8% | 18.0% | 0.2% |
| St. John’s A | 16.41 | 51.6% | 16.2% | 0.1% |
| Strake Jesuit A | 17.83 | 43.9% | 12.2% | 0.1% |
| IMSA A | 18.06 | 42.7% | 11.6% | 0.1% |
| Auburn A | 18.30 | 41.6% | 10.9% | 0.0% |
| Blair B | 18.96 | 37.8% | 9.0% | 0.0% |
Particularly for the lower teams on this list, the chances here are probably slightly inflated because upsets and oddities in the prelims were not accounted for at all in putting the teams in playoff brackets. Regardless, it should give a pretty good picture of how these teams would stack up in a full tournament rather than just a single game. It’s also a good way to see just how close some of the top teams are; TJ may be in the lead, but they’re hardly prohibitive favorites at this point.
That’s all I have for now. If there’s interest, I might update the model or make more nationals forecasts later in the season.
EDIT: The image of the graph used by Steven was accidentally excluded. This mistake has been fixed.
DOUBLE EDIT: A linear graph and histogram were also accidentally excluded. Apologies to Steven.
Steven Liu is currently a senior at High Technology High School in Lincroft, New Jersey. His new website using Groger Scores to calculate the probability of a team winning PACE can be found here: https://sirmrguy.github.io/qbmodel/index.html
